Such sensors reside in the system's CPU, Motherboard, Graphic Card (GPU), Hard-Disk and more.
I'll list some useful tools I'm using for monitoring the system temperatures.
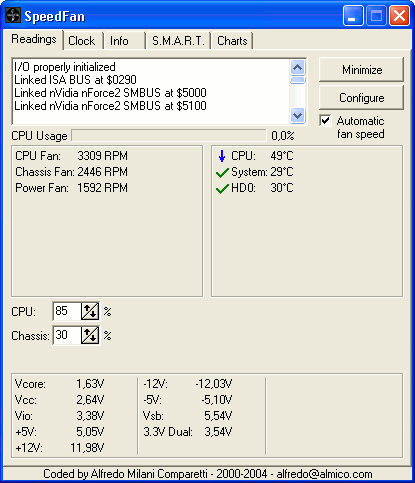
1. Speedfan
Features:
- Temperature monitoring
- Fan Speed Control
- Voltage Reading
- Hard-Disk SMART Checking
- Event-Notification including Popup & E-mail alerting
- Supports 32/64bit
Tips:
- Use the /s switch to do a silent install for mass-deployment.
- On warm systems set the min/max fan speed to 100% so that the fan would be in full-speed all the time.
- Use the options to "Start Minimize" and "Minimize on Close", than copy the Speedfan shortcut to the Start Menu Startup folder.
- Make sure you choose the relevant temperature sensor to be shown on the system tray.
License: Freeware
YaronMaor Rating: 5/5 *****
2. HWMonitor

Features:
- Reads the CPU Temperatures only but seperates the results for each CPU-Core.
- Identify the running hardware make and model (i.e. which CPU, which Graphic Card...)
- Portable (single EXE file that runs without installation)
Tips:
Check the Maximum temperature values column to see the peak values since last boot.
Export the results to a text file (.txt) using the File menu.
License: Freeware. Has an extended paid version called HWMonitor Pro
YaronMaor Rating: 3/5 ***
You can't control the fan speeds... I'm missing some background-monitoring functionality.
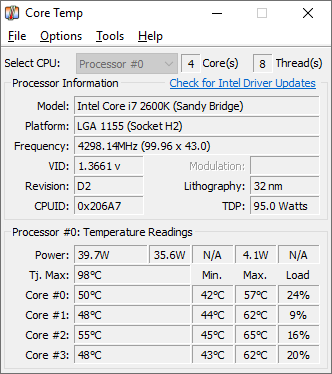
3. CoreTemp
Features:
- Reads Temperatures, Voltage and fan Speeds
- Portable (single EXE file that runs without installation)
- Fully Supports XP/Vista/Windows7 32bit & 64bit
- Can run in the background for monitoring & alerting
Tips:
Set the Overheat Protection parameters for alerting while running in the background.
Use the Screenshot option in the Tools menu to save a picture file of the current window.
Supports Add-Ons to extend functionality
Developers can use a shared-library to communicate with the program
License: Freeware.
YaronMaor Rating: 3/5 ***
You can only see the CPU temp...
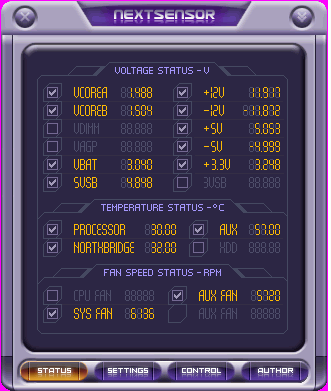
4. NextSensor
Features:
Temperature & Voltage monitoring.
Control for fan speeds
Advanced GUI with support for seperate icon on the system tray for each sensor.
Tips:
Set the sensors you want to monitor and run minimized while enjoying up to three dynamic notification icons for each sensor.
License: Freeware.
YaronMaor Rating: 2/5 **
Too graphically advanced so the functionality and quick-learning of use gets damaged...
5. SensorView

Features:
- Notification at critical values.
- You can set a threshold of concern and correction.
- Sending email.
- Graphs.
- Showing chosen parameter in the tray.
- Showing CPU usage.
- Showing physical memory usage.
- Showing HDD usage.
- Showing NIC usage.
- Log file for events and warning messages
License: Shareware. 19.95$-24.95$ (Used to be free until Dec/2005)
YaronMaor Rating: 3/5 ***
Not portable, Not freeware/Not Cheap...
Conclusion:
If I could get the functionality of Speedfan in a portable version with the development toolkit of CoreTemp it would have been the best.
One important feature I haven't yet found is the ability to run as a system-service for Windows-Servers and 24*7 running PC's.
I usually install Speedfan for permanent solution and use HWMonitor for quick glance using my USB-Disk.
Do you know any other tool that's worth checking? comment me and I'd be happy to share a review.
Cheers,
Yaron Maor