I'm addicted to Chrome... after you taste the speed you just can't go back to IE/FF...
Don't have it yet on your PC? get it here.
Some cool additions to the minimalistic browser from Google:
1. Chrome Add-ins
Get some over here and here...
2. Chrome Themes
From this link you can apply some refreshing themes to the browser. just click the Apply button and the theme will download and run immediately. Don't like the theme? you can always go back to the classic theme.
Aug 5, 2009


How To Debug BSOD Blue Screen Errors using BlueScreenView Utility
A new tool from the home of Nirsoft has come to the rescue.
Using BlueScreenView, a small portable debugging tool, you can easily find information regarding your previous Stop errors (also known as Blue Screen of Death).
The tool uses the saved memory dump files that Windows saves in the folder C:\Windows\MiniDump\
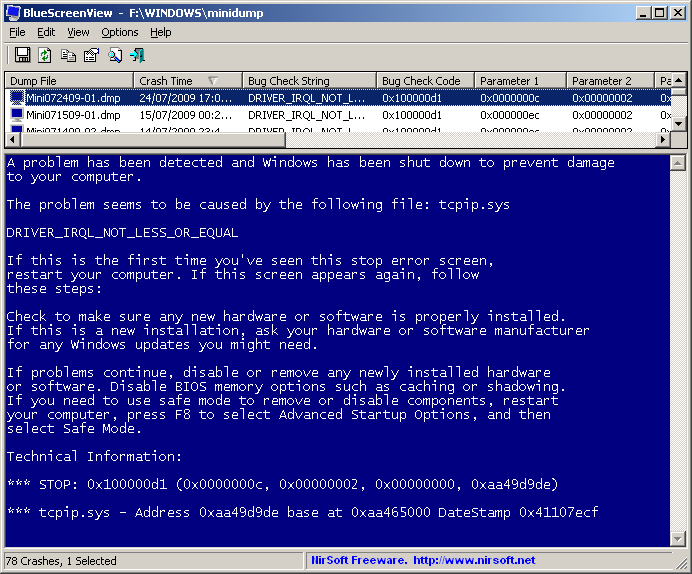
After running the tool you'll see a table listing each memory dump info including: date & time of crash, the Error Code and parameters and most important- the suspected driver/cause of the crash.
One small extra is the ability to change the detail view into a Blue-Screen simulation screen that shows you how the error message approximately looked like:
Why using this tool instead of the Windows Debugging Tools Pack from Microsoft?
1. it doesn't need another installation of external software.
2. it does a batch debug of all mini-dump files altogether instead of one-by-one using WinDbg.
3. it runs directly from your USB :)
Have fun!
YaronM
Using BlueScreenView, a small portable debugging tool, you can easily find information regarding your previous Stop errors (also known as Blue Screen of Death).
The tool uses the saved memory dump files that Windows saves in the folder C:\Windows\MiniDump\
After running the tool you'll see a table listing each memory dump info including: date & time of crash, the Error Code and parameters and most important- the suspected driver/cause of the crash.
One small extra is the ability to change the detail view into a Blue-Screen simulation screen that shows you how the error message approximately looked like:
Why using this tool instead of the Windows Debugging Tools Pack from Microsoft?
1. it doesn't need another installation of external software.
2. it does a batch debug of all mini-dump files altogether instead of one-by-one using WinDbg.
3. it runs directly from your USB :)
Have fun!
YaronM
Subscribe to:
Posts (Atom)